What's in Delhi's air, one particle at a time
My undergraduate physics research at UNT: firing a focused proton beam at air samples from New Delhi to map which metals sit in each particle, and what that says about where the pollution comes from.
My undergraduate research in physics at the University of North Texas. I was the undergraduate on an experimental team at UNT's Ion Beam Modification and Analysis Laboratory (IBMAL), with Todd A. Byers, Gary A. Glass and Bibhudutta Rout. We used micro-PIXE, a proton-beam technique, to map the elements inside air particles collected in New Delhi.
The question
New Delhi has some of the worst air in the world. Its PM2.5, the particles smaller than 2.5 microns, averaged around 150 micrograms per cubic meter. Dallas and New York sit around 16, and the EPA's line for healthy air is below 35.
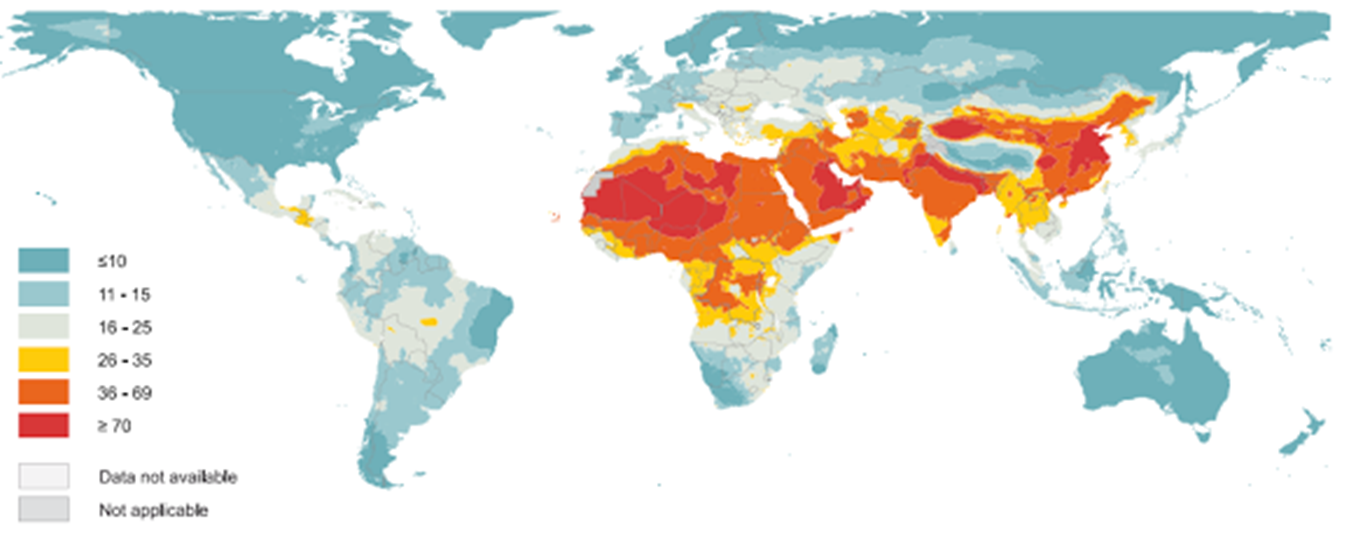
Knowing how much is in the air doesn't tell you where it came from. A particle from a blast furnace, a cement plant, a car's exhaust or a crop fire is made of different things. If you can read what's inside each particle, you can start to trace it back to its source.
Size matters too. PM2.5 mostly comes from local sources. PM10, up to 10 microns, can be dust blown in from hundreds of miles away.
How micro-PIXE works
PIXE stands for Particle Induced X-ray Emission.
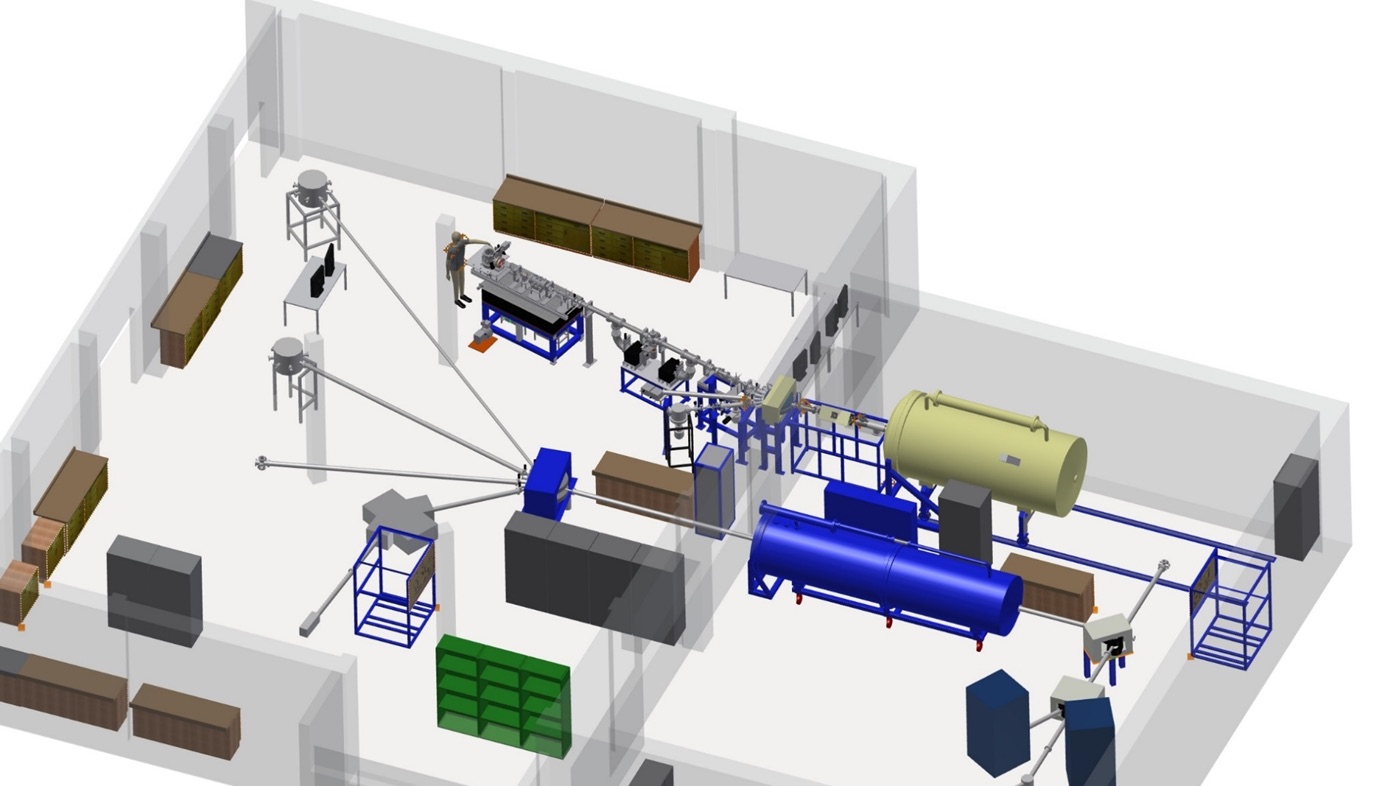
- Fire protons at the sample. IBMAL's accelerator makes a proton beam at 1 to 3 MeV and focuses it to under a micron.
- Knock out inner electrons. A proton hitting an atom can kick out one of its innermost electrons. An outer electron drops into the gap and gives off an X-ray.
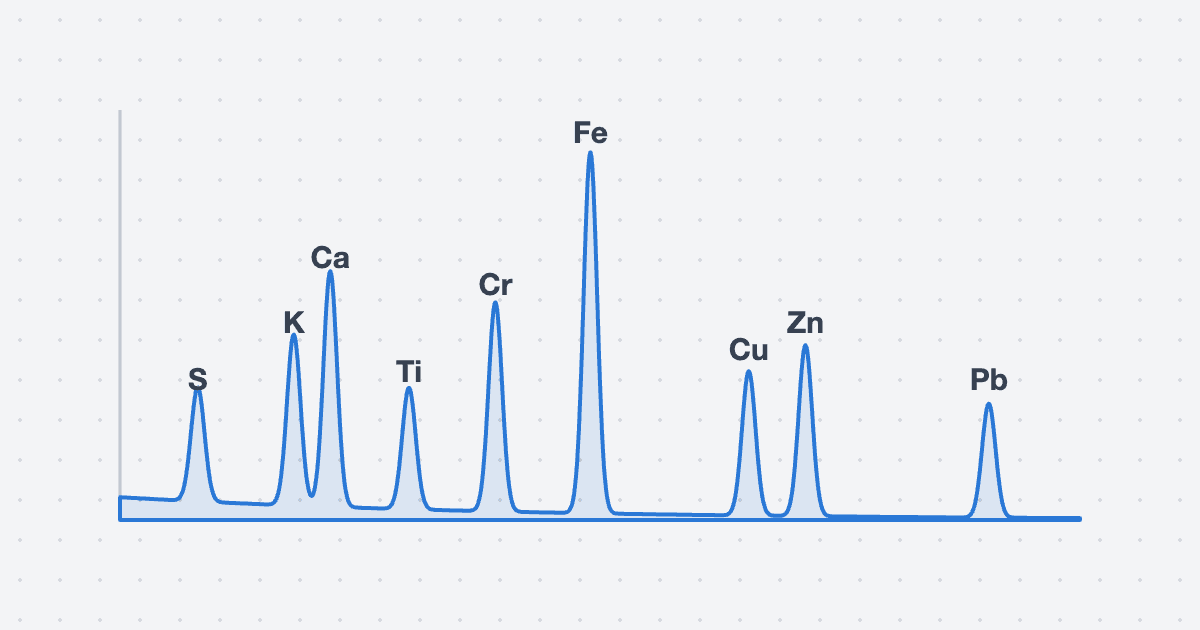
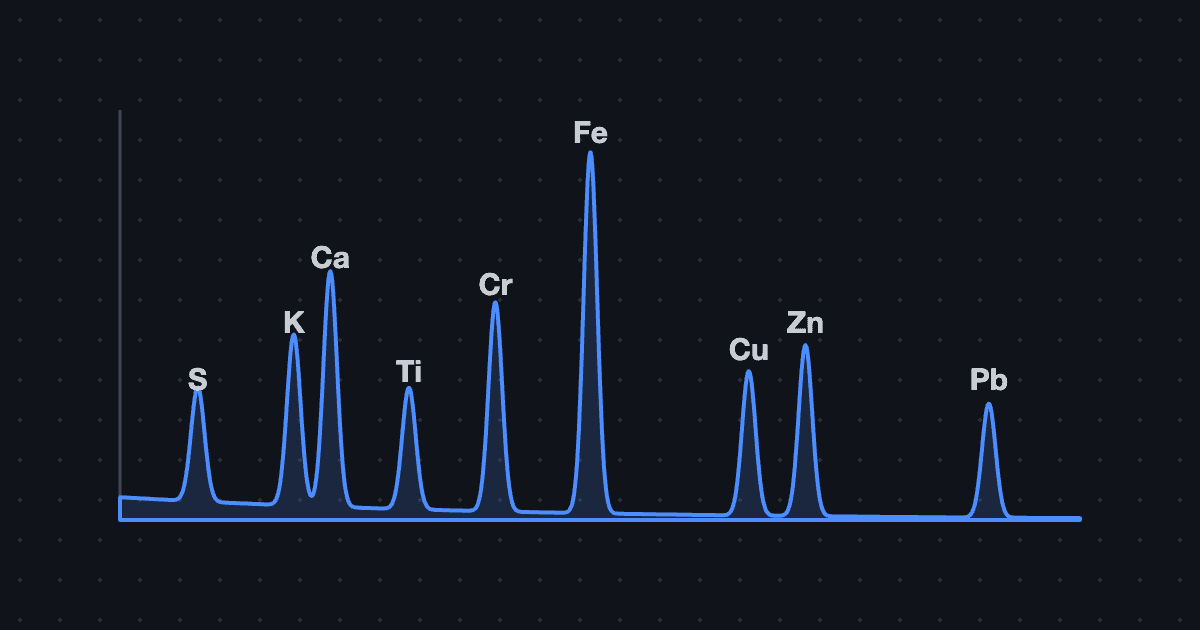
- Read the X-ray's energy. That energy is a fingerprint: iron's is different from zinc's, which is different from lead's. A detector sorts the X-rays by energy into a spectrum, and each peak is an element.
- Scan the beam. Move the focused beam across the sample point by point and you get a map of where each element sits, particle by particle.
Here's one event at a time. Pick an element, watch the peak build, or count 250 more at once.
1. A proton flies in
From the accelerator, at 1 to 3 MeV.
2. It knocks out an inner electron
One of the two closest to the nucleus (the K shell).
3. An outer electron drops in
It gives off the energy difference as an X-ray.
4. The detector reads the energy
Each element's X-ray has its own energy. One count goes on the spectrum.
The spectrum · 0 X-rays counted
Protons are good at this. Electrons scatter as they go into a material, so the spot they probe spreads out. MeV protons go deep in a nearly straight line, so the beam stays small and the map stays sharp. Samples need very little preparation.
Fingerprints for each source
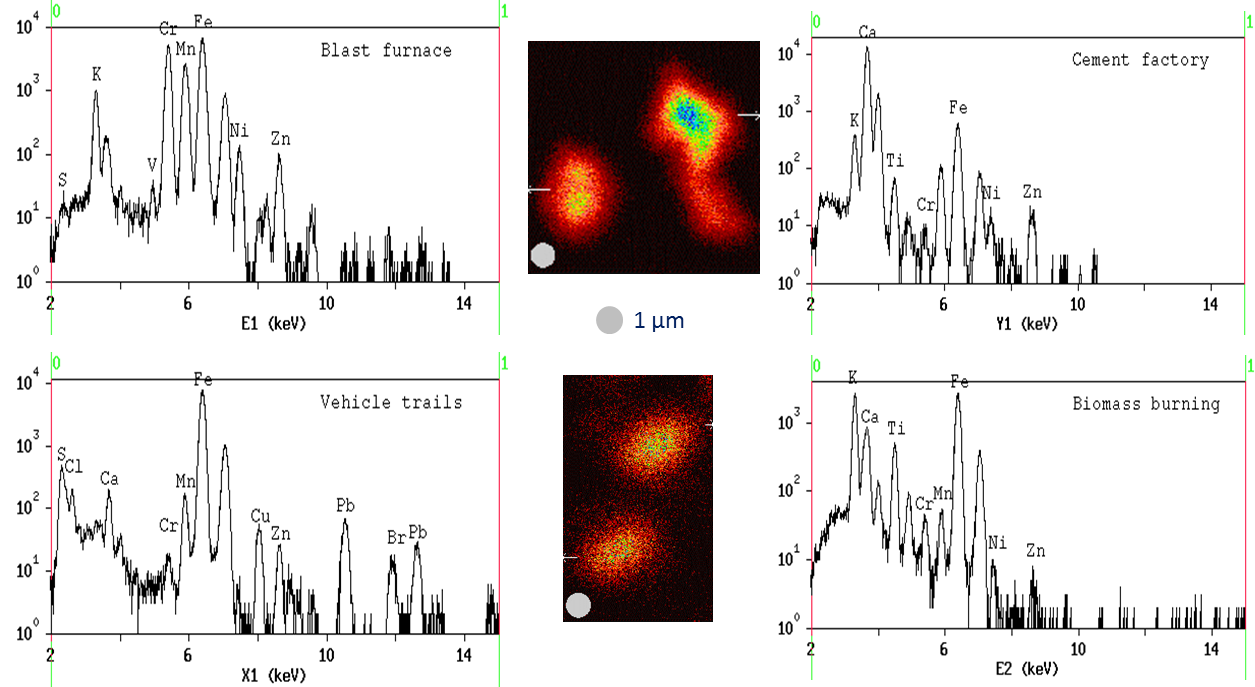
To read a sample, you first need to know what each kind of pollution looks like. These reference spectra come from samples collected earlier in Shanghai, which we used as a standard.
| Source | What stands out |
|---|---|
| Blast furnace | Chromium, manganese and iron, with nickel and zinc |
| Cement factory | A tall calcium peak |
| Vehicle trails | Sulfur and chlorine, plus lead and bromine |
| Biomass burning | Potassium, calcium, titanium and iron |
Delhi, January 2018
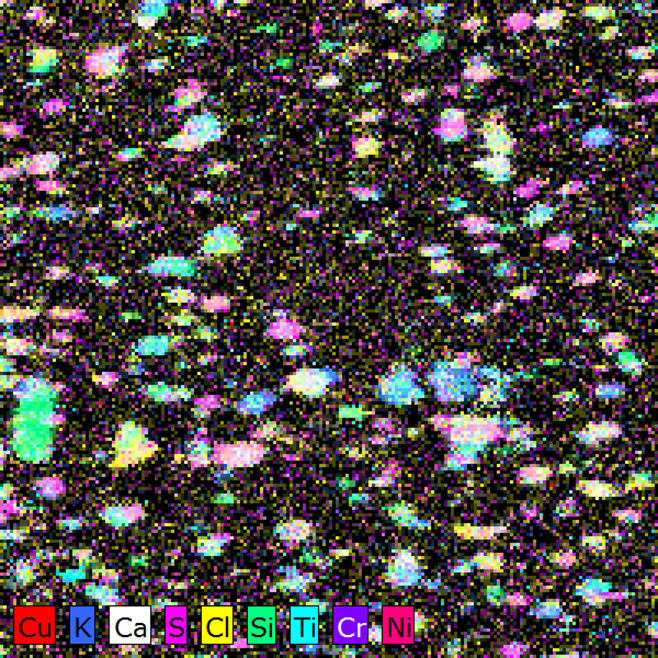
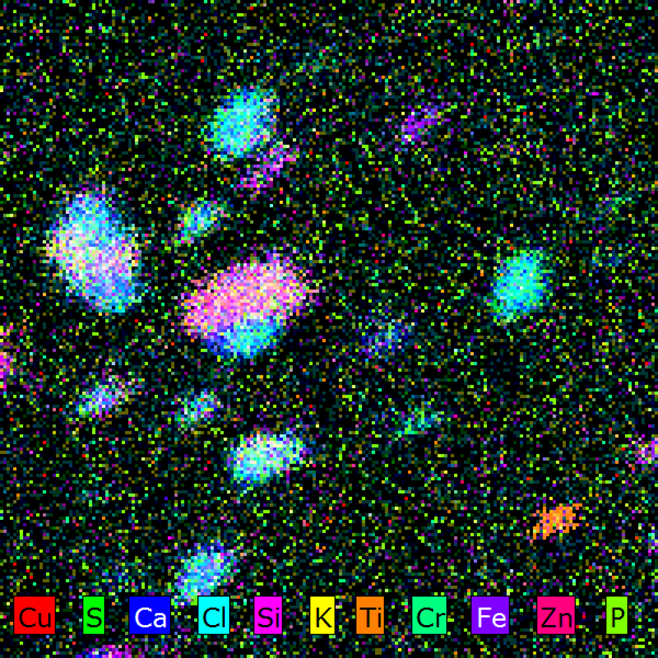
The samples were collected in New Delhi in January 2018, when the air quality index hit 450, far into the hazardous range. Each map below is a scan of one sample. Every colour is an element, and every blob is a single particle.
What we found
- The maps show the size of each particle and which elements it carries.
- Some particles were as big as 20 to 30 microns.
- Many carried metals: copper, iron, zinc and chromium. Those are the ones that do real damage when you breathe them in.
What was next
The plan was to build a statistical model that matches each particle's elements to the source fingerprints, so a sample could be split by where its pollution came from. We also planned to collect samples around industrial sites in Denton and the Dallas–Fort Worth area and run the same analysis closer to home.